It becomes important that with all the tools you have in production, you can test the same flows end to end on local with very fewer efforts. The rationale behind such is the reduced feedback cycle that saves a dev from taking a long time to achieve the desired outcome.
I was working with sending some telemetry data from my Golang web application to Prometheus and then create a Grafana dashboard out of it. But to test the flow I needed a local setup of Prometheus + Grafana so that I can check if the metrics are right and that I am building the right PromQL query to create the dashboard.
I am maintaining a Github repo for all the docker-compose setup I require for my local testing and now Prometheus + Grafana is a new addition to it. If you also need a similar setup and save your setup time in future and focus more on building things refer to this post or my Github Repository.
Clone the repo:: https://github.com/ninadingole/docker-compose-stacks
Then go to prometheus-grafana folder and run docker-compose up -d.
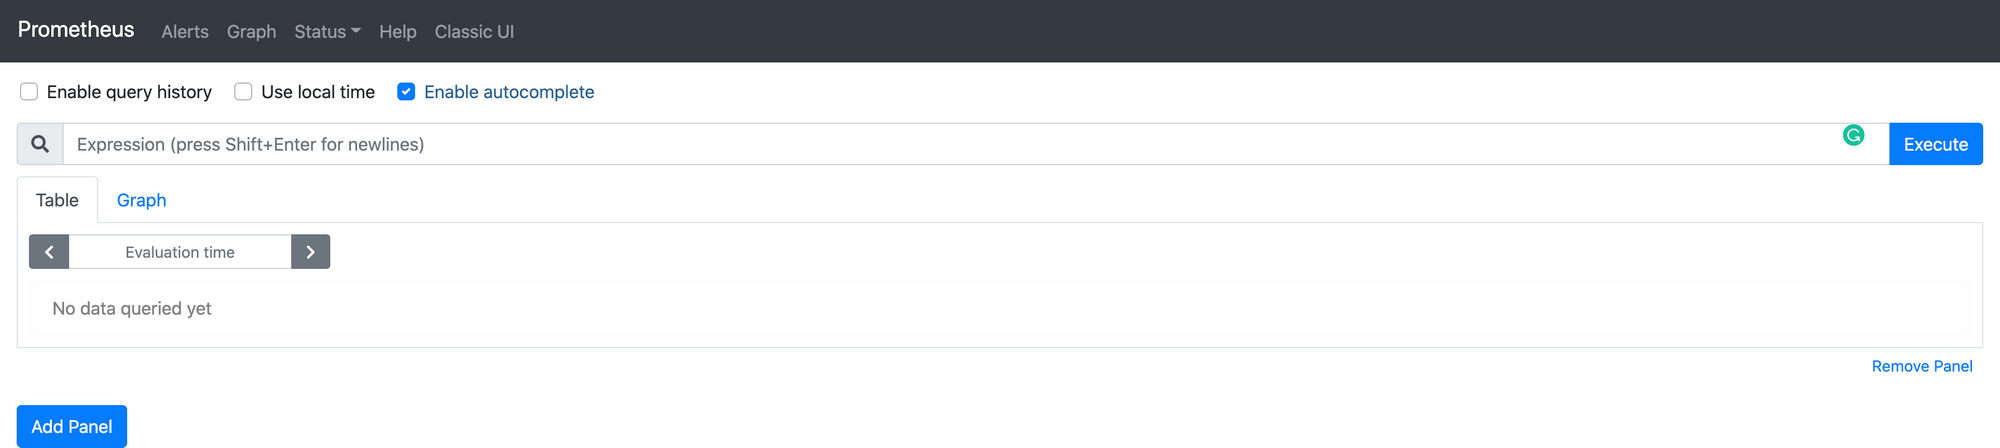
This will start Prometheus on http://localhost:9090 and Grafana on http://localhost:3000.
There is also a prometheus.yml configuration file which you can use to add the local apps that you want to scrape, a note:: if your application is running inside a docker then use host.docker.internal as your hostname with the port to scrape the target.
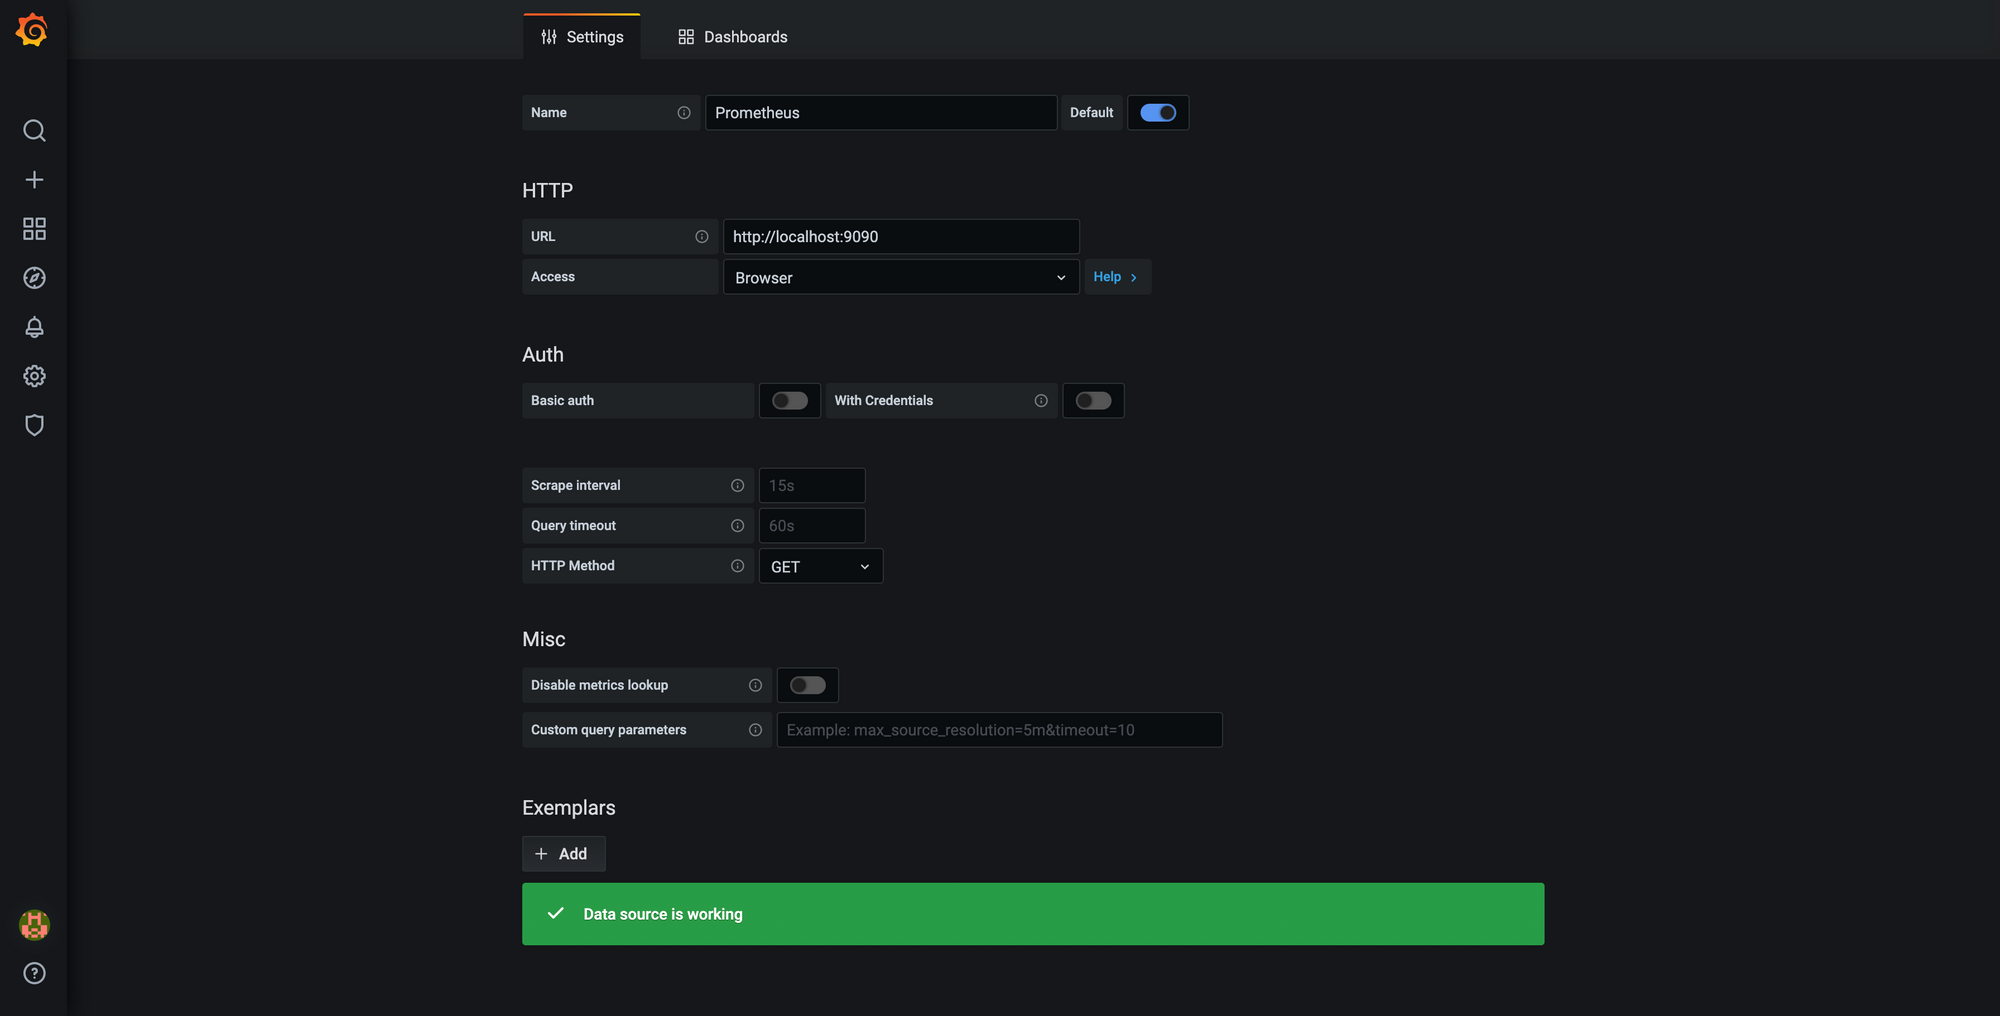
Once you have added the configs to connect Grafana to Prometheus like above image, you are ready with an end-to-end setup on your local.
I hope you will find this docker-compose configuration pretty useful and saves your time. Please subscribe to the blog to get more articles delivered right to your email inbox.
Thanks and Happy Coding!